LD 50 Lab
Pre Lab
Background
It is suspected that salt (NaCl) applied to highways for deicing may affect the growth of vegetation along the roadside and aquatic plants in nearby streams. Therefore, you will conduct a dose-response experiment to determine how radish seeds will respond to various concentrations of salt. Your teacher will provide you with a concentrated salt solution so that you can make serial dilution each of which are half as concentrated. You will set up a wide range of concentration of salt solutions to test on radish seed growth.
It is suspected that salt (NaCl) applied to highways for deicing may affect the growth of vegetation along the roadside and aquatic plants in nearby streams. Therefore, you will conduct a dose-response experiment to determine how radish seeds will respond to various concentrations of salt. Your teacher will provide you with a concentrated salt solution so that you can make serial dilution each of which are half as concentrated. You will set up a wide range of concentration of salt solutions to test on radish seed growth.
Hypothesis
A high level of salt solution concentrate will result in less plant growth as opposed to a smaller dose of salt solution.
Variables
Experimental Set-Up
Variables
- Independent variable: salt concentration
- Dependent variable: growth of radish seeds
- Control variables: salt solution, petri dish, napkin, seeds, water, graduated cylinder
Experimental Set-Up
- Control group: petri dish with 100% water, 0% salt solution
- Experimental group: petri dishes with with than 0% salt solution and less than 100& water
Problem
How much salt is too much for seed germination?
Materials
- 6 petri dishes
- 60 seeds
- 12 napkins
- concentrated salt water solution
- water
- graduated cylinder
Procedure
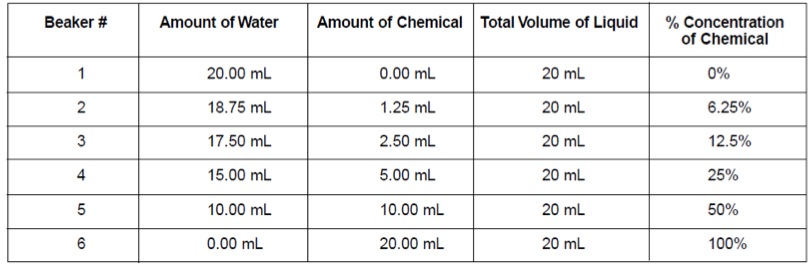
- Use the graduated cylinder and test tubes to prepare the various concentrations as shown below.
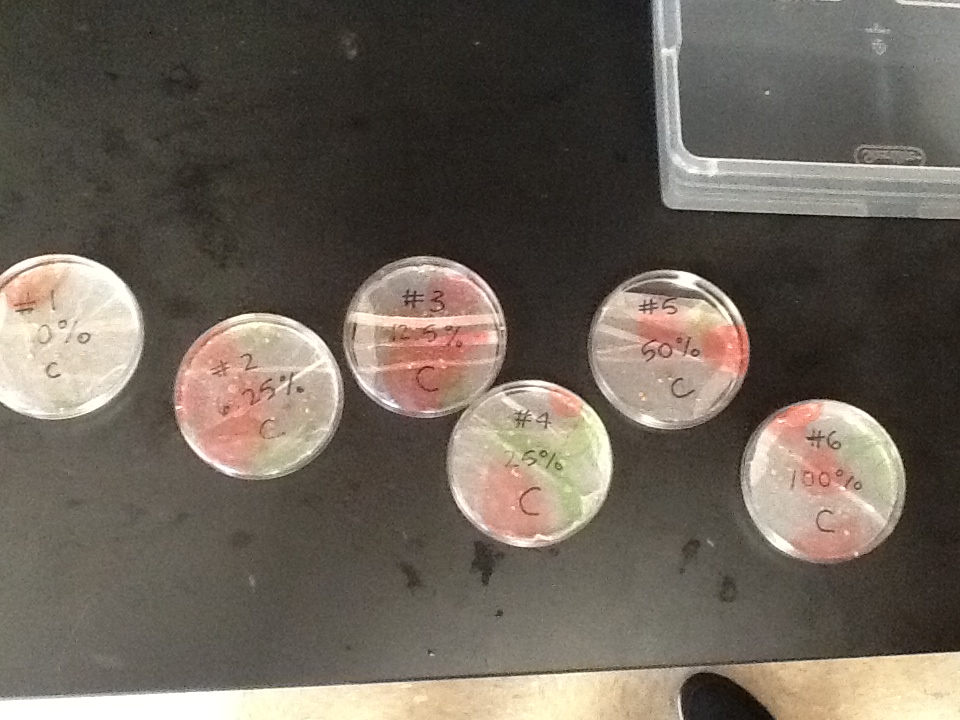
2. Label all six petri dishes with your group number, the dish number, and a percent concentration of chemical:
3. Put two napkins together and cut them so that they fit into the petri dish.
4. Put on the safety goggles and latex gloves. Carefully pour the chemical solutions onto the napkins, making sure to match the numbers and concentration percentages of the dish.
5. Count out 10 seeds. Carefully place the seeds on the moist napkins in the petri dish.
6. Repeat steps 3-5 for the other dishes.
7. Place the seed dishes in a stack, lying glat with the seeds up. Put the seeds in the spot designated by your teacher.
- Dish #1: 0%
- Dish #2: 6.25%
- Dish #3: 12.5%
- Dish #4: 25%
- Dish #5: 50%
- Dish #6: 100%
3. Put two napkins together and cut them so that they fit into the petri dish.
4. Put on the safety goggles and latex gloves. Carefully pour the chemical solutions onto the napkins, making sure to match the numbers and concentration percentages of the dish.
5. Count out 10 seeds. Carefully place the seeds on the moist napkins in the petri dish.
6. Repeat steps 3-5 for the other dishes.
7. Place the seed dishes in a stack, lying glat with the seeds up. Put the seeds in the spot designated by your teacher.
Observations and Data
You will measure the response of the radish seeds at carious salt concentrations. After the seeds have germinated, count the number of seeds that germinated and measure the length of each radical (embryonic root). After recording the results, you will create two graphs (% seed germination and dose-response curve) to help you analyze the data collected.
- Remove the lid of the control dish. Count the number of seeds that germinated. Calculate the percentage of seeds that germinated and record in Table 2.
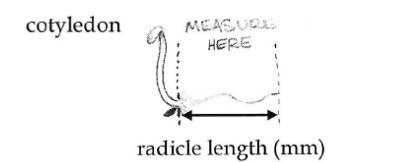
- Measure the length of the radical for each of the germinating radish seeds to the nearest millimeter. Look carefully at each sprout to make sure you are measuring just the root, not the shoot as well. In the picture below, you would measure just the part between the two arrows, not the shoot and cotyledons to the left.
3. Repeat steps 1-2 for each petri dish.
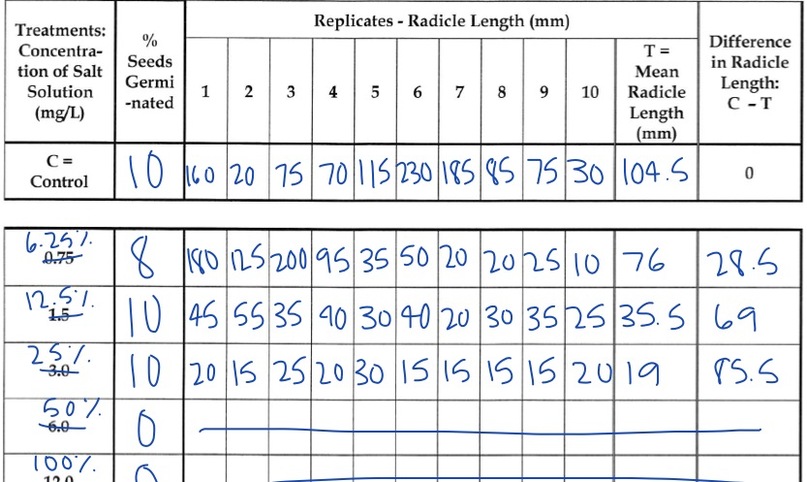
4. For each treatment, calculate the mean radical length for each salt solution. Add the total radical lengths for each salt solution and divide by the total number of seeds that germinated. Do not include data from seeds that did not germinate. Record data in column labeled, "Mean Radical Length"
4. For each treatment, calculate the mean radical length for each salt solution. Add the total radical lengths for each salt solution and divide by the total number of seeds that germinated. Do not include data from seeds that did not germinate. Record data in column labeled, "Mean Radical Length"
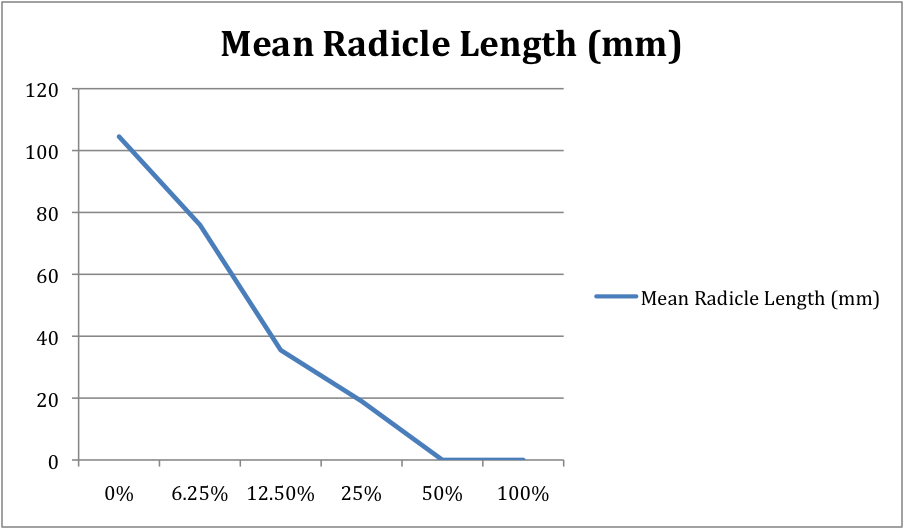
5. Make a line graph from the data collected to show a dose-response curve. The horizontal axis should be for the independent variable, dose (concentration of salt solutions). The vertical axis should be for the dependent variable, response (mean radical length). Remember to give the graph a title.
6. To help you answer "DId the radical length increase of decrease in length as compared to the control?" subtract the mean radical length of each treatement from the mean radical length of the control. Record you answers in the column, "Differences in Radicle Length" on the data table.
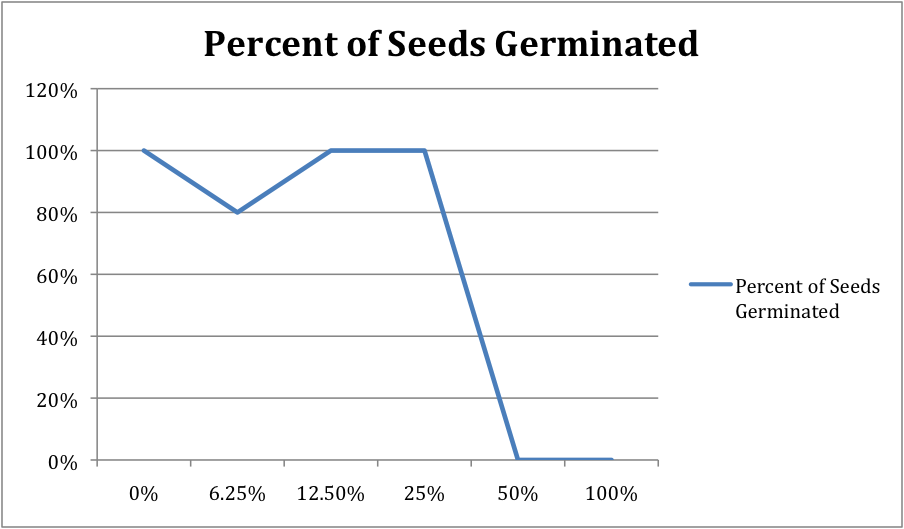
Make a line graph to show the percentage of seeds that germinated for each salt solution.
Make a line graph to show the percentage of seeds that germinated for each salt solution.
Analysis and Conclusion
Questions Specific to Lab
General Conclusion Questions
- What appears to be the LD 50 for salt for radish seeds? Support your answer with data. The LD 50 for salt for radish seeds was 50% concentration, 10 mL of chemical, because there was no germination of seeds past this point. You can see on the line graph that the drop is dramatic.
- Is your radicle data supported by your germination data? Support your answer with data. Yes, the radicle data supports the germination data. Just like the germination line graph, the radicle line graph's line does a dramatic drop after 19. Mean radicle length decreased as salt concentration increased.
General Conclusion Questions
- Evaluate your Hypothesis. The hypothesis was correct. As the salt solution dose increases, plant growth and germination decreases.
- Possible sources of error. The petri dishes were hard to hold and move. Due to this, a lot of the water and salt solution was spilled in the process of moving the dishes from the counter to the box. Also, the graduated cylinder was not an efficient way of measuring the salt solution. Maybe a dropper would have been better. Another thing- the sprouts were really hard to measure. There may not be a better way to measure them, though.
- Application. It is important to know how to determine the dose of survival. This LD 50 lab teaches people to be aware of the zones tolerance and the threshold. In the experiment, people got to experience negative feedback. Not only did they experience this, but they also saw limitations to the negativity and a line was drawn between that negativity and positivity.
